Last updated: 30 December 2024
Next review: 30 December 2025
This content is part of the Waltham Forest JSNA. To see other JSNA content, visit the JSNA landing page
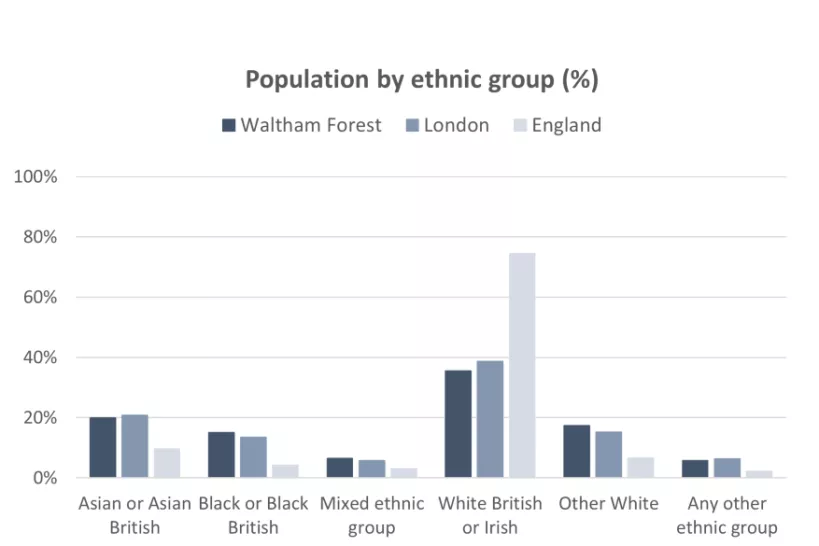
Waltham Forest is one of the most ethnically diverse local authorities in England. Based on the 2021 Census, around 64% of the population are from ethnic groups other than White British or Irish, compared to 61% in London and 26% across England.
This includes 20% of population who are identifying as Asian or Asian British; 15% Black or Black British; 7% from Mixed or Multiple ethnic groups; 19% from Other White and 6% from any other ethnic group.

Source: Office for National Statistics, Census 2021. Date accessed: 09/03/2023.
Out of the 19 available options for describing their ethnic group, most of Waltham Forest’s population come from the following groups: White British (34%); Other White (17%); Pakistani (10%); Black African (7%); and Black Caribbean (6%).
Table 1. Population by ethnic group in Waltham Forest, 2021 Census
| Ethnic group | Ethnic subgroup | Count | Percentage |
|---|---|---|---|
| Asian or Asian British | Bangladeshi | 5,200 | 2% |
| Chinese | 2,600 | 1% | |
| Indian | 9,100 | 3% | |
| Pakistani | 28,700 | 10% | |
| Other Asian | 9,900 | 4% | |
| Black or Black British | African | 18,800 | 7% |
| Caribbean | 17,600 | 6% | |
| Other Black | 5,300 | 1% | |
| Mixed or Multiple ethnic groups | White and Asian | 3,900 | 1% |
| White and Black African | 2,800 | 1% | |
| White and Black Caribbean | 5,100 | 2% | |
| Other Mixed | 6,200 | 2% | |
| White | British | 94,000 | 34% |
| Irish | 4,200 | 2% | |
| Gypsy or Irish Traveller | 200 | 0% | |
| Roma | 1,400 | 1% | |
| Other White | 46,400 | 17% |
Source: Office for National Statistics, Census 2021. Date accessed: 09/03/2023.