Financial Context
Last updated: 4 March 2024
Next review: 4 March 2025
The figures below are net of income. There will be a continued focus on commercialism where possible, effective contract management and working with partners to secure value for money in delivering our strategic aims and priorities. We will be redesigning services where appropriate to ensure they remain modern and fit for purpose.
Image
Image
What are the main risks on the horizon?
- Provider failure and market stability – availability of workforce, and the market’s expectation about fee levels moving to the Fair Cost of Care median rate.
- Social Care reforms remains uncertain on the level of funding and costs associated with the revised implementation dates.
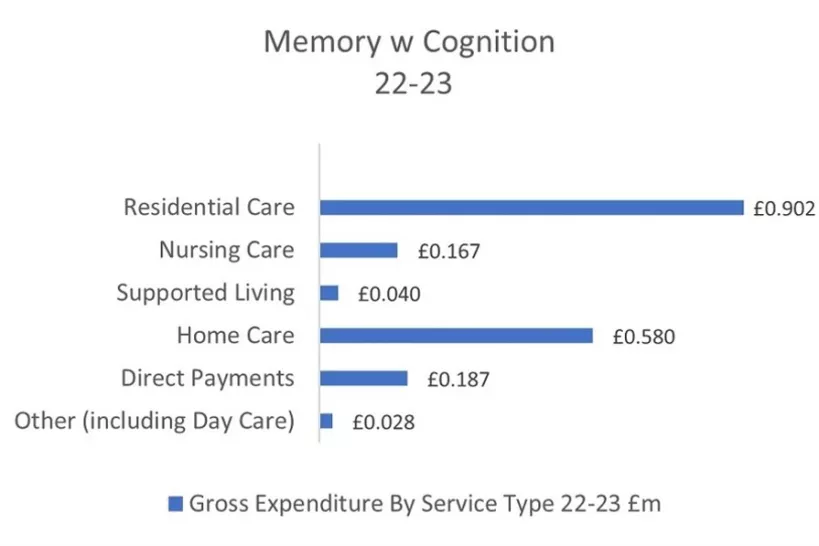
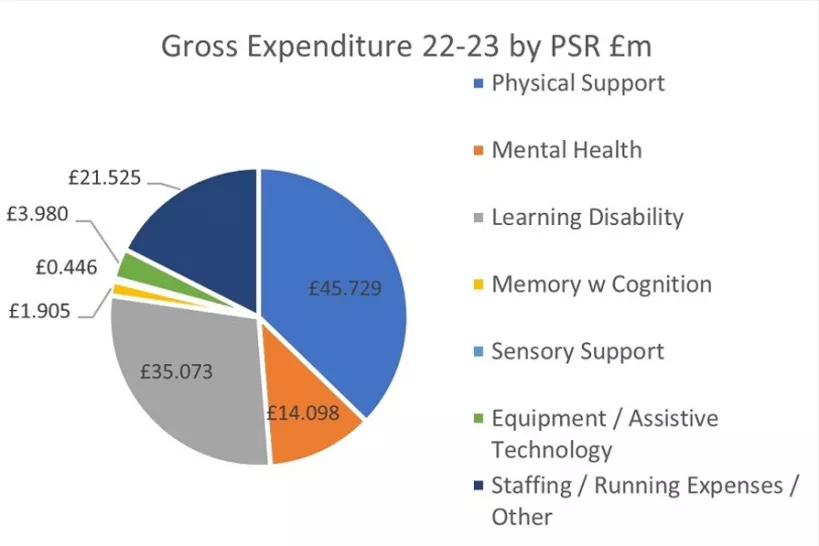
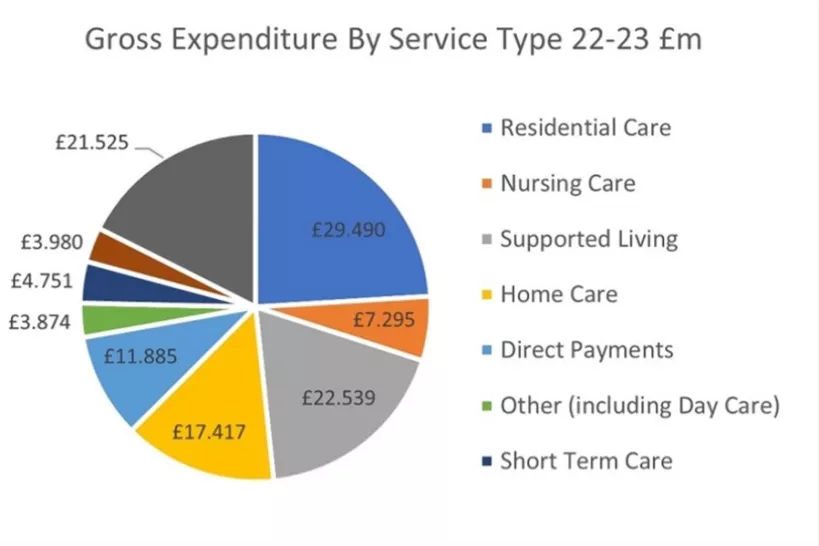
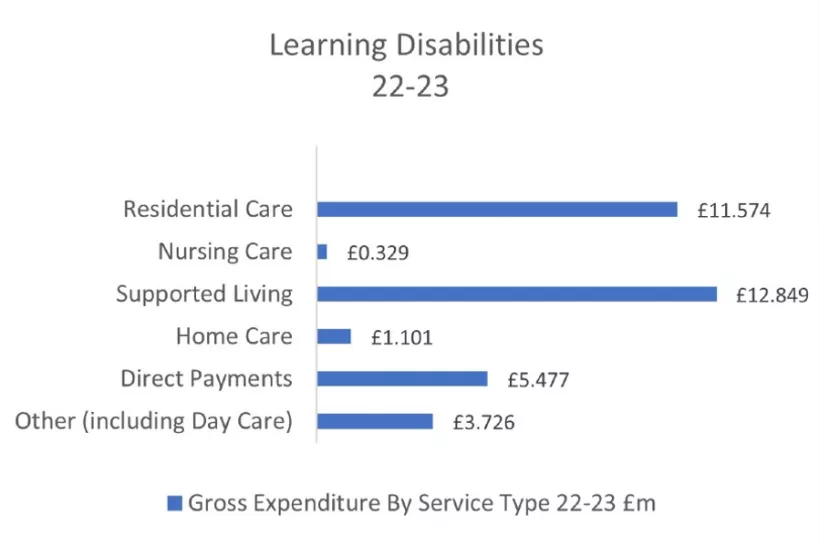
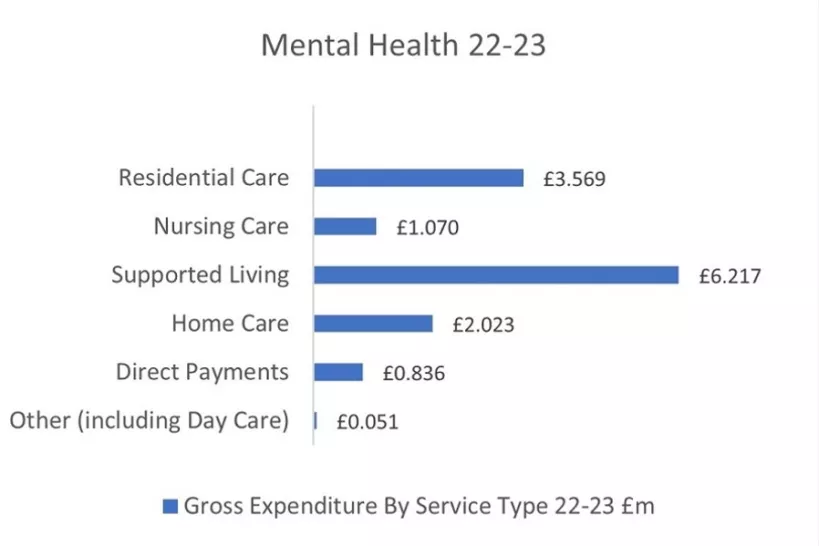
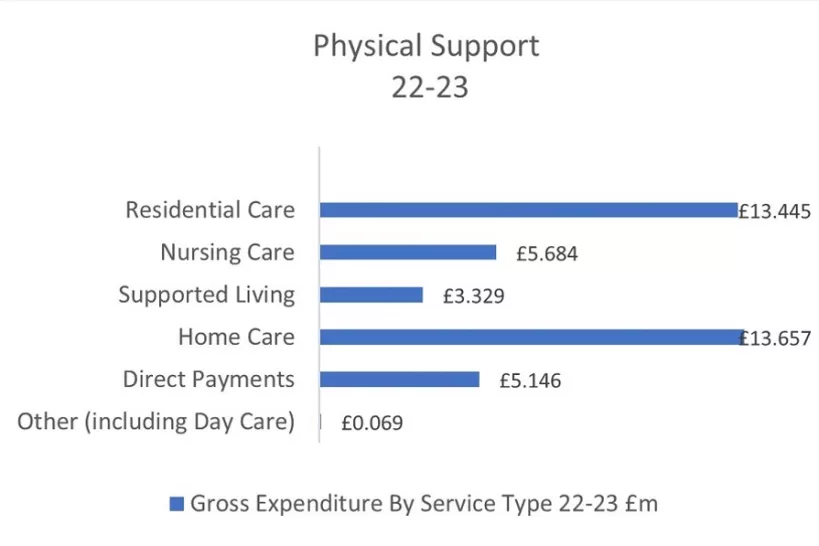
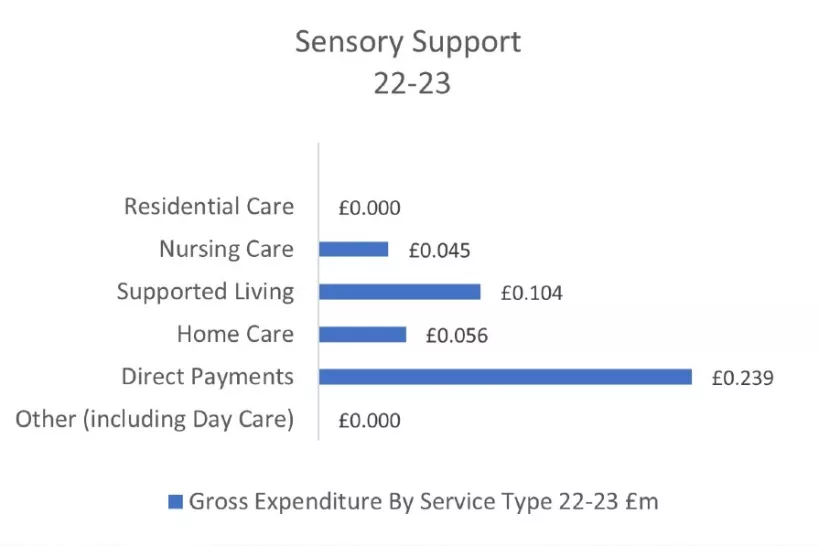
Below shows the breakdown of our cohort budget for 2022/23:
Image
Image
Image
Image
Image
